Real Time Energy Monitoring Leave a comment
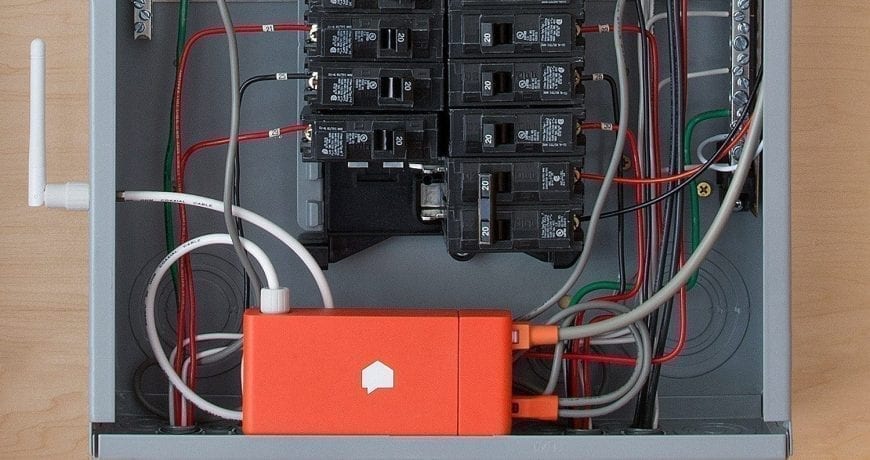
This is Sense.
Sense installs in your home’s electrical panel and provides insight into your energy use and home activity through our iOS, Android, and web apps.
Globalsolarsupply.com Has all the Sense products in stock and ready to ship to you fast
Once you receive Your Sense monitor and it has been installed, now it’s time to get oriented inside the Sense app. This is where all power consumption and usage activity gets reported from the Sense monitor; clearly, instantly, and in real time. In this post, we’ll look at the app’s four main screens.
Now – a real-time tally of every watt your home is using.
Trends – historical energy trends by day, week, month and device.
Devices – individual usage statistics and information for individually discovered devices.
Settings – account info, Wi-Fi configuration, Alexa/IFTTT integrations, and much more.
Energy intelligence in real time
The Now screen displays both instantaneous power use and a timeline of every device that turns on or off. This is the screen you’ll likely be checking most often – it’s the quick-to-read snapshot of your home’s activity. The Power Meter at the top displays your energy usage in real-time.Try turning on a light or appliance – you’ll see the reading change instantly when it goes on and off. If you want to get very granular, pinch and zoom into the meter (this works best with the app in portrait orientation).
You can also see usage plotted as a bubble graph, with bubble size relative to power consumption. Bubbles appear for each device that’s been detected, as well as your “Always On” load, which accounts for phantom loads that seem to always be on, like DVRs, printers, Wi-Fi speakers, and desktop computers that consume a small amount of power in “standby” mode. When you first open the app, you might only have one or two bubbles shown, but that number will grow over the coming weeks as Sense listens to your home and identifies more devices.
The timeline on the bottom half of the Now screen displays historical use of any discovered devices. Tap a device to get detailed usage information and statistics, or to categorize and rename mystery devices and set up notifications. Remember, Sense needs some time to learn your home, and the devices in it. As new devices are discovered, they’ll start to appear here on the timeline.
Analyze your energy use
The Trends screen makes it easy to see how your home is consuming energy over time.
Right away you’ll see where you can set and track goals to reduce your energy use. Also on the Trends screen is the Usage section. Here, you can track how much energy your home is using day-to-day. To dig into your Usage information, tap the small arrow just to the right of the Usage section. You can view by the day, week, month. year, or billing cycle (if you’ve defined your billing dates in the Settings screen). By default, you’re seeing total energy use for your whole home represented in green, but you can also click on individual devices to see Trends for that device (in green) versus your total use (in grey). To see total usage in kWh or dollars for a particular day, press and hold your finger on that day’s bar graph.
Now quickly tap that day (without holding) for an hourly view of your energy use. The graph now shows usage for each hour of the day, represented as a bar. This is very helpful if you’re trying to shift usage to take advantage of off-peak utility rates during other parts of the day. Or, if you have solar, to better sync up your consumption with your energy production, like charging your EV in the middle of the day when solar generation is at its highest. You’ll notice that the statistics for each device also change as you modify the viewing range.
In addition to the Usage view in the Trends screen, the Power Meter here shows consumption over the last 24 hours. You’ll likely see some spikes when large appliances were turned on. Tap the arrow on the right of the Power Meter to see a detailed real time representation of what’s on right now right down to the sub-second level. Scroll left to see past activity, and you can also pinch with two fingers to zoom out. This is where you can see some of the particular signatures that each device has when it turns on or off. Sense detects devices by identifying these signatures and other unique qualities in the context of your home.
Your Home’s Devices
The Devices screen gives you a bird’s-eye view of all the devices that have been discovered in your home, listed first by what is currently on, and then alphabetically after that. During the first few weeks after installation, this list may be limited, but the longer your monitor is installed, the more devices Sense will learn and the longer this list will grow. If devices are currently turned on, the app indicates that in green. By tapping on any of them, you’ll go into the Device Detail view and see their historic usage statistics, and if you’ve added your electricity costs to the app, you can even see how much that device is costing you to operate.
For unknown devices that have been discovered by Sense but not yet named, you’ll see a list of Community Names which leverages crowdsourced data to give you insights into what other Sense users have named similar devices, and your can also use these historical data clues to help pinpoint what they are. By tapping the gear icon in the top right of the screen, you can also add the make and model. By doing this you’re also helping to contribute to the accuracy of the Community Names feature, and helping the Sense data science team build its database of device signatures, in turn improving detection accuracy for the entire user community. This Details tab also includes fields for information that is unique to your home, like the location, and personal notes like “Filter changed 01/01/17” to help you stay organized and up-to-date with your appliance maintenance.
Tapping on the Manage tab reveals controls for whether or not that particular device is displayed on the Timeline of the Now screen, settings for basic or customized notifications, and controls to Merge the device with another (like combining multiple independently-detected elements of a dishwasher or clothes dryer), Delete a device (if you no longer have it, or it seems to be misfiring), and Report a Problem to the support team. This last point is useful when Devices display as being “On” when they actually aren’t. You can report “Device is Not On” and help inform those detection algorithms.
Account Settings
The last main screen inside the Sense app is Settings, where you can customize how Sense works for you and access some of the more advanced features. Under the Account tab, you can opt to receive push and email notifications when new devices are discovered, or when mystery devices are found. Nested inside My Home, you’ll find the Sense Monitor tab, which provides all the details of your hardware, including firmware versions (firmware updates automatically overnight), Wi-Fi configuration, and real-time metering of your electrical mains. You’ll also see the the Data Sources tab where you can enable other inputs for Sense to monitor like Network Device Identification. Under Connected Devices, you can connect Sense to hundreds of other smart devices in your home through IFTTT, or setup our integrations with Philips Hue and Amazon’s Alexa. You can also set the electricity cost and billing cycle start date if you’d like to track your power use in dollars in cents as well as kWh. Finally, the Help section provides you with links to useful guides and troubleshooting tips.
The Sense app is your dashboard of what’s going on (and off) in your home. Take some time, explore its features and get a better understanding of your power usage.
Have a suggestion to improve the Sense monitor or app? Be sure to reach out to our support team here. And don’t forget to join the Sense community forum to share your stories, suggest features and connect with other Sense users